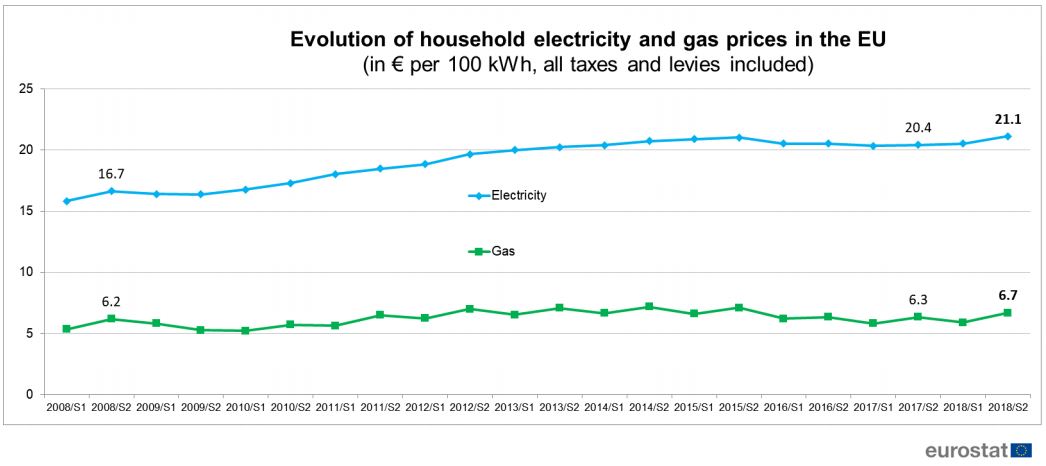
On average, household electricity prices in the European Union (EU) increased to €21.1 per 100 kWh (+3.5%), between the second half of 2017 and the second half of 2018. Nevertheless, the average EU household electricity price was only €0.1 per 100 kWh higher than in the second half of 2015, the former peak in the last ten years.
Across the EU Member States, household electricity prices in the second half of 2018 ranged from €10 per 100 kWh in Bulgaria to around €30 per 100 kWh in Denmark, Germany and Belgium.
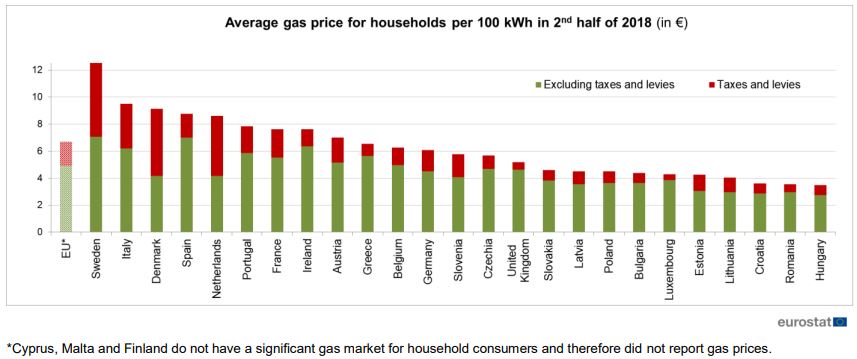
Household gas prices increased by 5.7% on average in the EU between the second semester of 2017 and 2018 to €6.7 per 100 kWh. This is still €0.5 per 100 kWh lower than in the second half of 2014, the peak of gas prices in the last ten years. Among Member States, household gas prices in the second half of 2018 ranged from below €4 per 100 kWh in Hungary, Romania and Croatia to around €9 per 100 kWh in the Netherlands, Spain, Denmark and Italy and more than €12 per 100 kWh in Sweden.
Taxes and levies in the EU made up on average over a third (37%) of the electricity price charged to households in the second half of 2018, and about a quarter (27%) of the gas price.
Highest increase in electricity prices in Cyprus and Spain, largest falls in Latvia and Poland
Across the EU Member States, the highest increase in household electricity prices in national currency between the second half of 2017 and the second half of 2018 was registered in Cyprus (+19.6%), followed by Spain (+13.8%), the Netherlands (+9.7%), the United Kingdom (+8.6%), Ireland (+7.8%) and Estonia (+7.5%).
Decreases were observed in only four countries: Latvia (-4.5%) followed by Poland (-2.5%), Germany (-1.6%) and Lithuania (-0.9%).

Expressed in euro, average household electricity prices in the second half of 2018 were lowest in Bulgaria (€10.1 per 100 kWh), Lithuania (€11.0) and Hungary (€11.2) and highest in Denmark (€31.2), Germany (€30.0) and Belgium (€29.4). The average electricity price in the EU was €21.1 per 100 kWh.
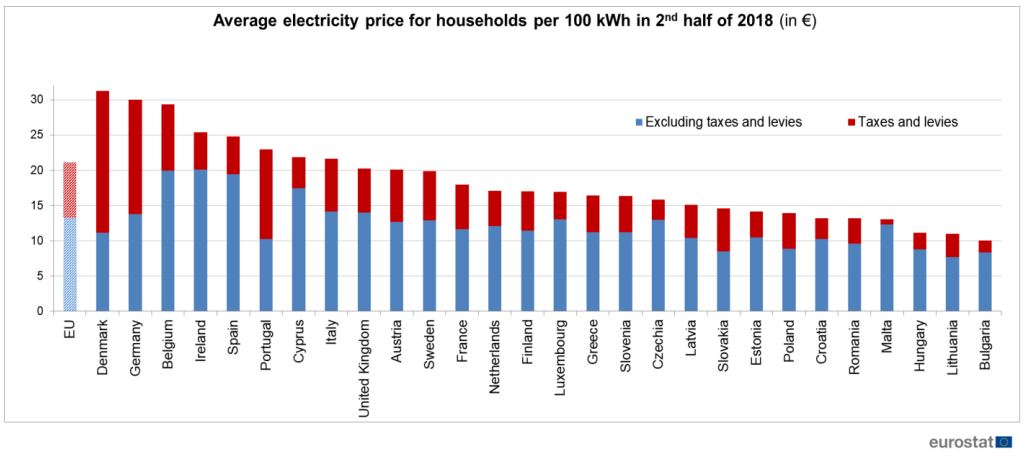
Expressed in purchasing power standards (PPS), a common reference eliminating general price level differences between countries, it can be seen that the lowest household electricity prices were found in Finland (13.7 PPS per 100 kWh) and Luxembourg (13.8), followed by the Netherlands (15.2), Malta (15.7), France (16.4), Sweden (16.5) and Lithuania (17.3). The highest prices expressed in PPS were registered in Portugal (28.2), Germany (28.0), Spain (27.4), Belgium (26.6), Romania (26.3), Cyprus (24.5) and Poland (24.3).
Half or more of the electricity price is made up of taxes and levies in Denmark, Portugal and Germany
The share of taxes and levies in total household electricity prices varied significantly between Member States, ranging from two-thirds in Denmark (64%) and over half in Portugal (55%) and Germany (54%) to only 6% in Malta. On average in the EU, taxes and levies accounted for more than a third (37%) of household electricity prices in the second half of 2018.
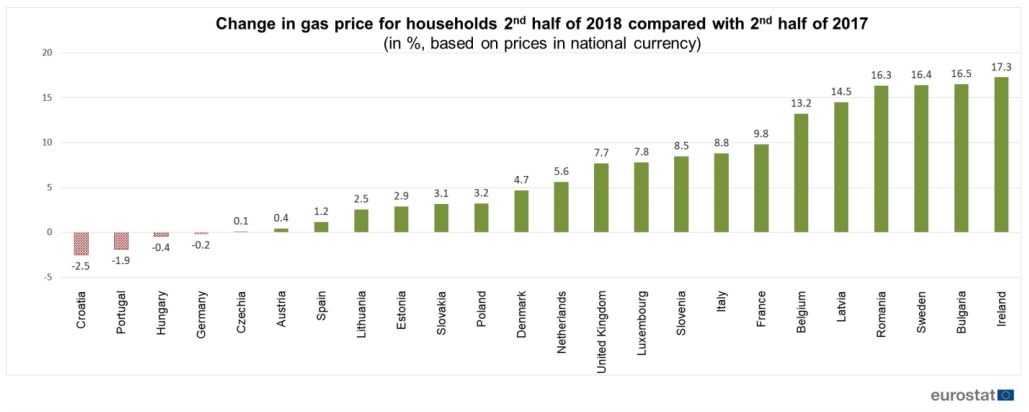
Highest increases in gas prices in Ireland, Bulgaria, Sweden and Romania, largest drop in Croatia
Between the second half of 2017 and the second half of 2018, household gas prices in national currency increased in twenty Member States. The highest increases were observed in Ireland (+17.3%), followed by Bulgaria (+16.5%), Sweden (+16.4%) and Romania (+16.3%). In contrast, decreases were recorded in Croatia (-2.5%), Portugal (-1.9%), Hungary (-0.4%) and Germany (-0.2%).
Expressed in euro, average household gas prices in the second half of 2018 were below €5 per 100 kWh in Hungary and Romania (both €3.5 per 100 kWh), Croatia (€3.6), Lithuania (€4.1), Estonia and Luxembourg (both €4.3), Bulgaria (€4.4), Poland and Latvia (both €4.5), and Slovakia (€4.6). Gas prices above €10 per 100 kWh were recorded in Sweden (€12.2), followed by Italy (€9.5), Denmark (€9.1), Spain (€8.8) and the Netherlands (€8.6). The average gas price in the EU was €6.7 per 100 kWh.
These figures on energy prices in the EU are complemented with an article published by Eurostat, the statistical office of the European Union.
Adjusted for purchasing power, it can be seen that, relative to the cost of other goods and services, the lowest household gas price was recorded in Luxembourg (3.5 PPS per 100 kWh), ahead of the United Kingdom (4.7) Croatia and Estonia (both 5.6) as well as Belgium and Germany (both 5.7). In contrast, the highest prices were observed in Sweden (10.1), Spain (9.7), Italy and Portugal (both 9.6).
Highest share of taxes and levies in gas price in Denmark and the Netherlands, lowest in Luxembourg and the United Kingdom
In the second half of 2018, taxes and levies made up the largest contribution to the price of gas for households in Denmark (54% of household gas price) and the Netherlands (52%). They were followed by Sweden (42%), Italy (35%) and Slovenia (30%). At the opposite end of the scale, the smallest contributions were registered in Luxembourg and the United Kingdom (both 10%), ahead of Greece (14%), Romania (16%) and Bulgaria, Czechia, Ireland and Slovakia (all 17%). At EU level, taxes and levies accounted on average for about a quarter (27%) of household gas prices in the second half of 2018.
Geographical information
The European Union (EU) includes Belgium, Bulgaria, Czechia, Denmark, Germany, Estonia, Ireland, Greece, Spain, France, Croatia, Italy, Cyprus, Latvia, Lithuania, Luxembourg, Hungary, Malta, the Netherlands, Austria, Poland, Portugal, Romania, Slovenia, Slovakia, Finland, Sweden and the United Kingdom.
The euro area includes Belgium, Germany, Estonia, Ireland, Greece, Spain, France, Italy, Cyprus, Latvia, Lithuania,
Luxembourg, Malta, the Netherlands, Austria, Portugal, Slovenia, Slovakia and Finland.
Methods and definitions
Household energy price data are reported by National Statistical Institutes, Ministries, Energy Agencies or, in case
of monopolies, by single companies.
The prices include basic price, transmission, system services, meter rental, distribution and other services. The prices are collected and published considering three levels of taxation: prices excluding taxes and levies; prices excluding VAT and other recoverable taxes; prices including all taxes, levies and VAT.
Electricity prices refer to prices for a household with an annual consumption of between 2 500 and 5 000 kWh, and include taxes. These prices are weighted by national household consumption to give the EU averages. The final price charged to electricity customers will depend on the structure of electricity tariffs and contracts which normally contain a number of factors, including fixed charges and unit prices that vary according to the amount of electricity and the time of day it is consumed.
Gas prices refer to prices for a household with an annual consumption of between 5 555 and 55 555 kWh of gas and include taxes. These prices are weighted by national household consumption to give the EU averages. The final price charged to gas customers will depend on the structure of gas tariffs and contracts which normally contain a number of factors, including fixed charges and unit prices that vary according to the volume of gas consumed.
The selected bands are the most representative of the population of the EU as most consumers in EU fall into these bands.
Source: EUROSTAT