EU mostly on track. Research & development and poverty alleviation lagging behind.
The Europe 2020 strategy, adopted by the European Council in June 2010, is the European Union’s agenda for jobs and growth for the current decade. As a main objective, the strategy strives to deliver high levels of employment, productivity and social cohesion in the Member States, while reducing the impact on the natural environment. To reach this objective, the EU has adopted targets to be reached by 2020 in five areas: employment, research & development (R&D), climate change & energy, education and poverty reduction. These have been translated into national targets in order to reflect the situation and possibilities of each Member State to contribute to the common goal. A set of nine headline indicators and additional sub-indicators, compiled by Eurostat, given an overview of how close the EU is to its overall targets.
A complete picture of trends in the Europe 2020 headline indicators
The analysis in the Eurostat publication is based on the Europe 2020 headline indicators used to monitor progress
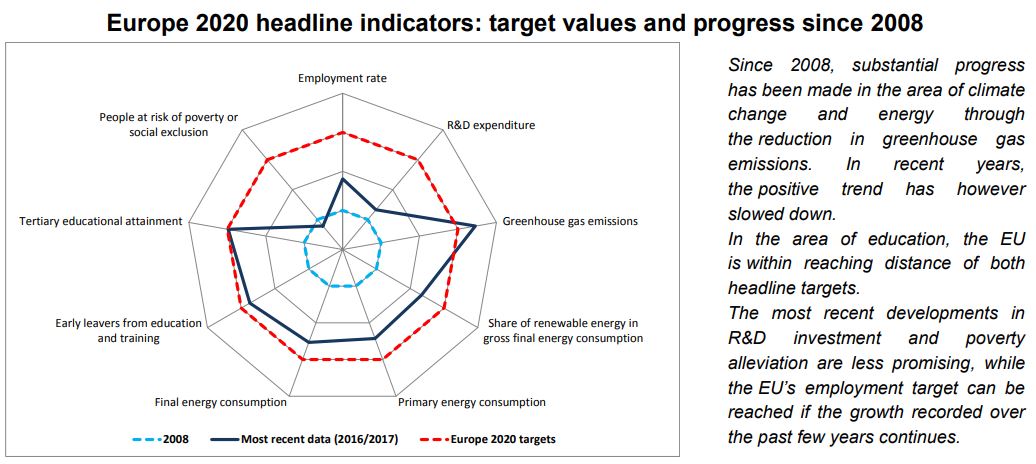
towards the strategy’s targets. Other indicators focusing on specific subgroups of society or on complementary issues are used to deepen the analysis and present a broader picture. The publication aims to shed light on the trends in the headline indicators over the past years and helps understand the factors behind the changes observed so far. The radar chart below presents the current situation of the EU by showing the progress made since 2008 and the distance still to cover towards the Europe 2020 key targets.
What is the situation in each EU Member State?
The five thematic chapters of the publication are followed by a country profile for each Member State. These country profiles give an overall picture of the situation in relation to the national Europe 2020 targets. The country profiles provide for each Member State a table with the national Europe 2020 indicators and illustrate the situation in each Member State in the form of a radar chart, which shows the distance between the most recent data and the defined national targets.
For more information
Eurostat website section dedicated to the Europe 2020 strategy.
Eurostat scoreboard on Europe 2020 headline indicators.
Source: Eurostat